 Climate
 Privacy
 Bob Dylan
 Drones
 Data Centers
 AI Governance
 2026 Maine Senate Race
New Dashboard Tracks U.S. Extreme-Weather Trends
Coverage from The Honest Broker, American Enterprise Institute, and others
Articles
3
Days Since Update
2
The Story
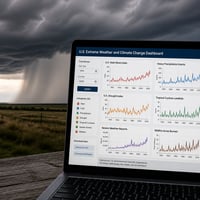
Roger Pielke Jr. has launched the THB U.S. Extreme Weather and Climate Change Dashboard, a public tool tracking long-term observations across 32 variables and seven categories of weather extremes. The dashboard uses government and scientific records, lets users inspect time periods and download data, and frames results against IPCC assessments while avoiding attribution of specific events or trends to climate change. It is positioned as a replacement and expansion of climate indicators removed from EPA webpages in 2025, though its data sources and methods remain open to revision.
First Article: 07/30/26
Latest Article: 07/30/26
The Bigger Picture
Articles in this story are part of a shaping these topics.